Projections 2: a simple SEP projection

In the first post on projections we talked a bit about the theory behind projections. In this post we are going to try to create a very simple projection and talk about how it actually works.
To start with there is a very special stream inside the event store. This stream represents statistics measurements that are happening internally. You can control how often they are taken via config. To find this stream in your system you can assume you are bringing up a brand-new node look at the “Streams” tab when going to whatever port you set for HTTP.
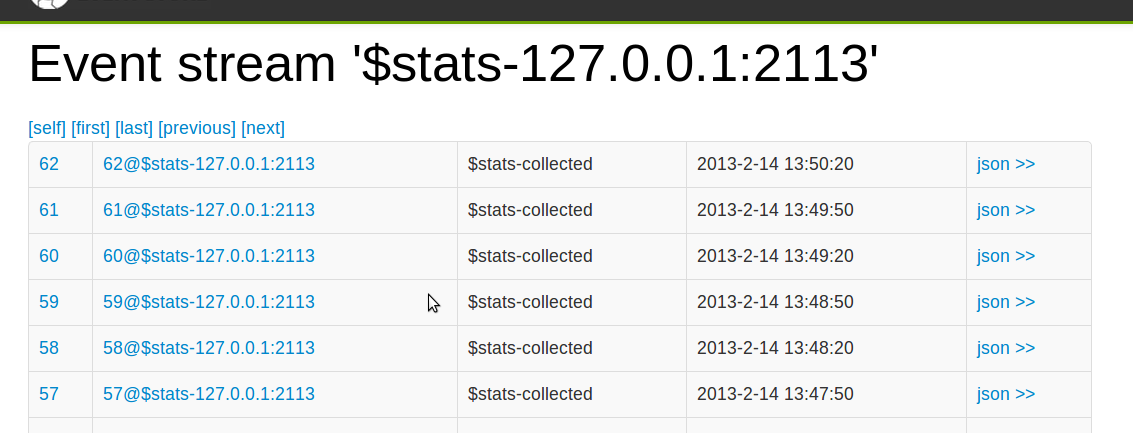
For me (the default) stream for statistics is $stats-127.0.0.1:2113. If you want to see statistics data you can point your browser to 127.0.0.1:2113/streams/$stats-127.0.0.1:2113 and view the data in the stream. You should see something that looks like this:

If you click on one of the events you should be able to see the actual data from a statistics event entry. If you want to save some time you can see it on my gist. This is a JSON encoding of what the statistics measurement looks like. We are going to write a basic projection against that stream.
fromStream('$stats-127.0.0.1:2113')
  .when({
    "$statsCollected" : function(s,e) {
      var currentCpu = e.body["sys-cpu"];
      if (currentCpu > 40) {
        emit("heavycpu", "heavyCpuFound", {"level" : currentCpu})
      }
    }
  });
If you want to test this projection. Go to new projection and paste it in. Give it a name and select emit enabled and for mode put continuous. We will discuss in a later post what these things mean.
This is a very simple projection. It’s not very interesting. We will get to doing more interesting ones shortly. What it does is it listens to your statistics stream. This is set up when it says fromStream this is says “listen to all events in stream s”. It then defines a function that will be passed all $stats-collected events which happen to be the ones we saw in the statistics stream above.
The function declared checks the sys-cpu field of the event. If the CPU is higher than 40% it emits a new event out to another stream called heavycpu. If you are running the projection you can bring up your CPU usage then try navigating to the stream 127.0.0.1:2113/streams/heavycpu. You will see an event there of the form.
EventStreamId: heavycpu,
EventNumber: 2,
EventType: heavyCpuFound,
Data: {
  "level": 40.9823952
},
Metadata: {
  "streams": {
    "$stats-127.0.0.1:2113": 49
  }
}
This is a very basic projection that is emitting a new event based on some criteria that is found. This is a very common pattern in event based systems (SEP). In the next post we will introduce state into our projection to look at how we can alert not just off a single event but off some group of events that are correlated which is another very common pattern in projections (SEP).
